01
Assembling
Six transit feeds, a walk network, a population raster, an air network — found, licence-checked, reprojected, joined.
Liveability baseline for European SUMPs
A fused 250 m picture of transit, heat, green and air for European cities, delivered in your formats — with every source, licence and disagreement published alongside.
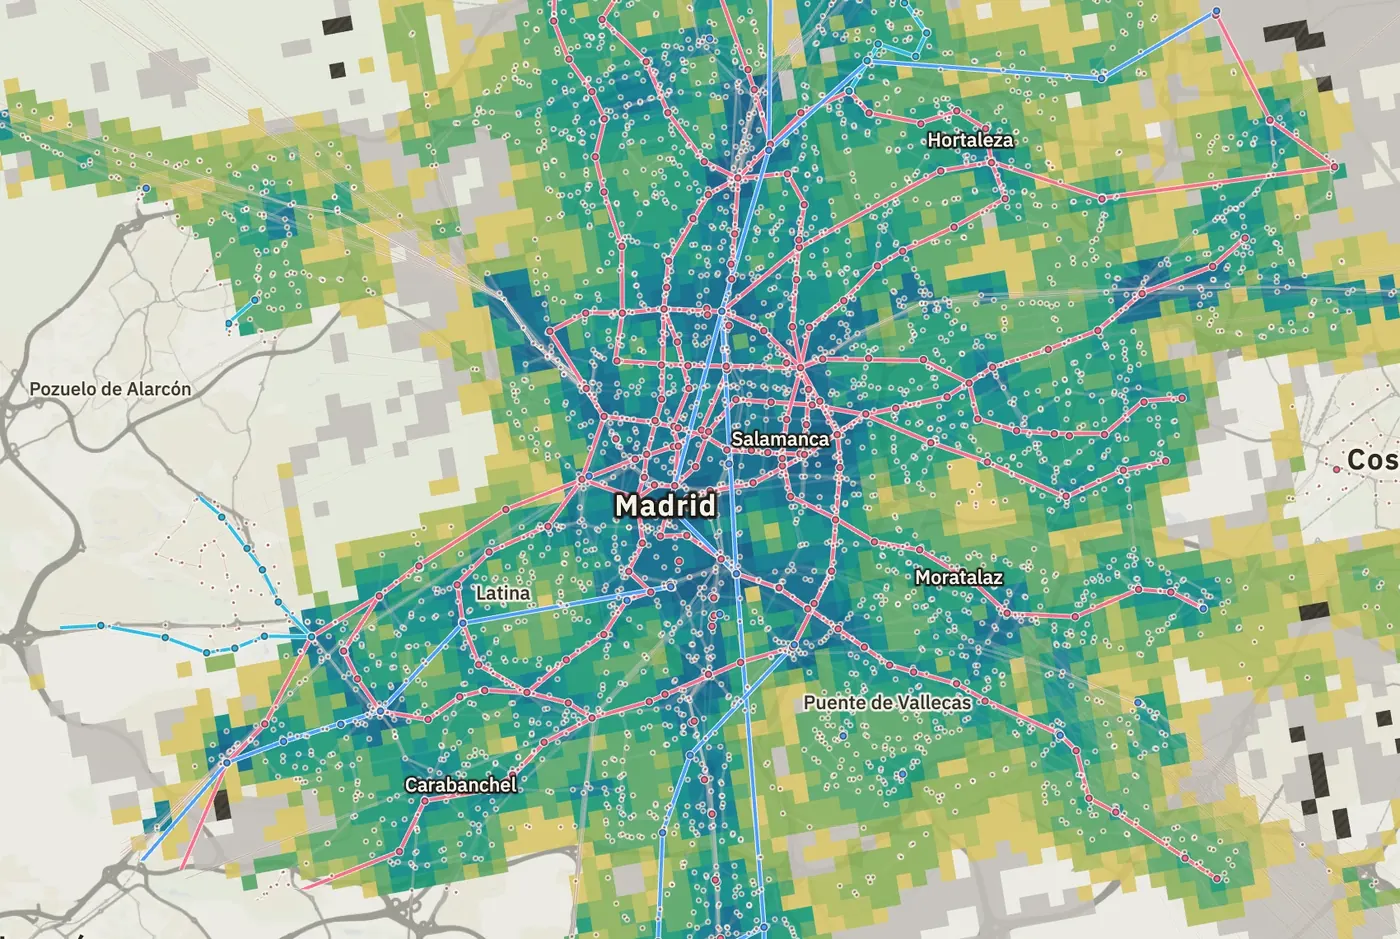
Madrid · full municipal run
Every metric lands on the same 250 m cells, for the full municipal boundary.
The job it removes
Accessibility, equity, the LEZ picture — rebuilt from scratch each project, from the same public sources, by the same senior people who should be writing the plan.
Six transit feeds, a walk network, a population raster, an air network — found, licence-checked, reprojected, joined.
Two publications by the same operator disagree. Someone has to decide what the baseline says.
Every committee asks where the number came from. The answer lives in a colleague's head.
What you get
A finished deliverable, in the formats you already work in — not a platform to learn.
Walk time to frequent service, departures per hour, reachable population, a PTAL-style index and band.
Land surface temperature on the same cells, so a well-served district's heat penalty is visible beside its access score.
Green provision and the pollutant picture from the city's own monitoring network, gridded to the same cells.
Residents per cell, the denominator under every equity statement in the plan.
GeoPackage into QGIS, styled plates for committee papers, a metrics CSV for the report, sourced headlines and a methodology note.
No login for your team, no dashboard to maintain, no subscription to renew before the plan is finished.
Fusion
A district well served by frequent service can still be punished on heat and starved of green. Only the fused view puts both facts on the same cell — and lets you re-weight which one matters for this plan.
A drawing of how re-weighting moves cells. Not measured data — the live demo shows the measured transit layer.
The denominator under every equity statement in the plan.
Walk times, departures per hour, reachable population, a PTAL-style index and band, and service flags.
Fits your workflow
Not a platform to learn — a deliverable that drops into your QGIS and your committee papers.
The evidence base arrives finished; your senior time goes to the diagnosis itself.
Residents per cell under every access, heat and green figure, so distribution statements carry a denominator.
Air and transit on the same cells as the boundary you are appraising.
Plates styled to print, with the source line already on them.
Glass box
Every figure is sourced, dated and licensed. Where two publications by the same operator disagree, we publish the disagreement rather than the more flattering half.
Comparisons against the operators' own published timetables that fall inside their published frequency band.
Comparisons that fall outside the published band: 5 higher, 3 lower. Published, not omitted.
Quality checks recorded for the Madrid run, with what each one returned.
Copernicus and Landsat for heat and green, CRTM/EMT/Renfe feeds for service, the city's own air-quality network, JRC GHS-POP for population.
Every figure describes scheduled service on one representative service day, named in the file. One feed's calendar had lapsed 63 days earlier; that is disclosed, never silently dropped.
Pan-European inputs and one pipeline, so a second city is comparable with the first rather than a fresh set of local choices.
Domingos y festivos · Desde las 6:05 · 20 Minutos
What it costs
One invoice, no subscription, no per-seat licence. Four things set the figure — send the city and the scope and you have a number the same day.
A city without a published GTFS feed is a different job — we will say so rather than quote for it.
See it live
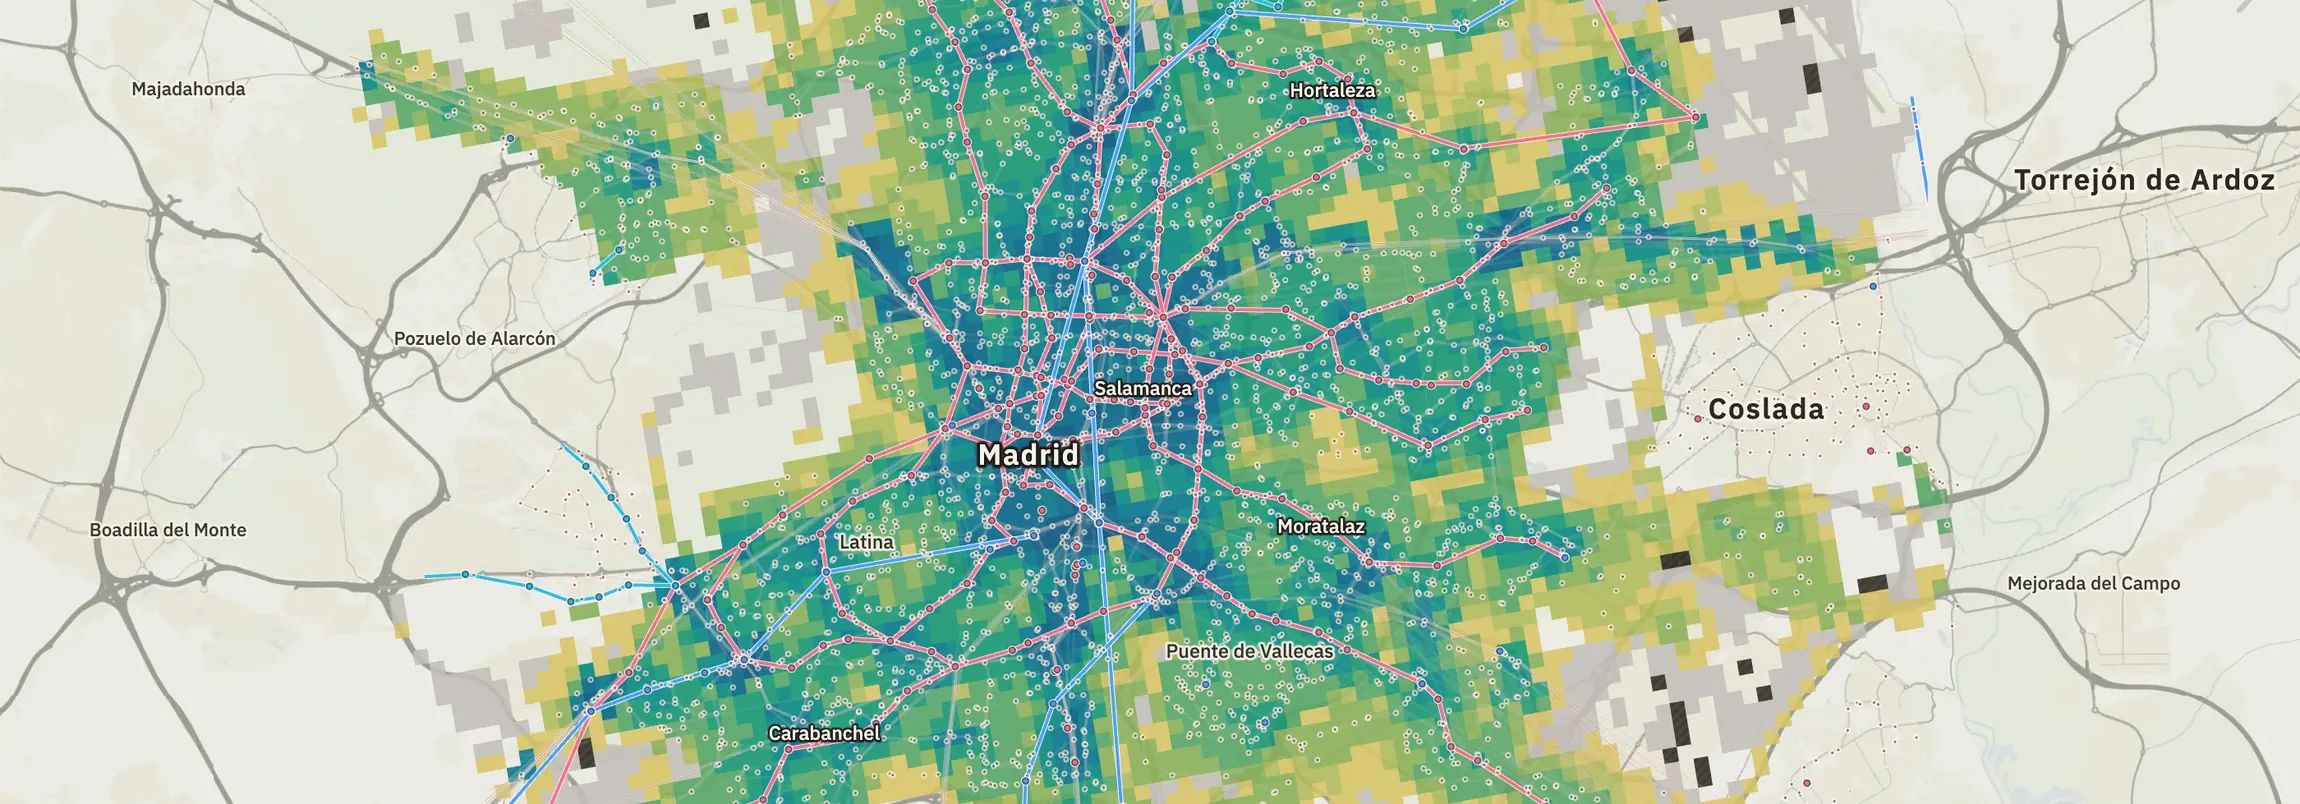
Thirteen metrics on 6,305 populated cells: walk time to frequent service, departures per hour, reachable population, PTAL band. The other layers are delivered in the baseline, not in this demo.
About
Spatial Spine is built by a data practitioner, not a platform vendor. The pipeline records its own code version as a digest, publishes its quality checks with what each one returned, and states what it does not measure.
Each with a source URL, a verbatim quote and a retrieval date — the reference set hash-pinned so it cannot be made to pass.
What it does not measure: whether services ran on time. No realtime feed, vehicle position or arrival observation is used anywhere in the dataset.
Request your city
We come back with what the baseline would contain, which sources cover it, and what it would cost. No signup, no trial.
Opens your mail client, addressed to hello@spatialspine.com, with the three things we need already in the body.
We reply with what the baseline would contain · usually within two working days.
Next step
Send the city and the boundary. We reply with what the baseline would contain, the sources behind it, and the price.
A 30-minute call · no deck, no signup